Visualizing OutputVars
This page is under construction, in the meantime, consult Visualize.
Masking part of the output in GeoMakie
When performing ocean or land simulations, it is often convenient to hide the other component (e.g., hide the ocean and focus on the continents). For GeoMakie plots, there is a direct way to accomplish this. In this section, we discuss this feature.
The main GeoMakie plots are Visualize.contour2D_on_globe! and Visualize.heatmap2D_on_globe!. Both these functions take a mask argument. By default, mask is nothing, meaning that the entire output is displayed on the globe. Alternatively, mask can be a collection of polygons that can be plotted with Makie.poly. ClimaAnalysis comes with the most important ones Visualize.oceanmask and Visualize.landmask, to hide ocean and continents respectively.
For example, suppose var is the variable we want to plot with an ocean mask
import ClimaAnalysis.Visualize: contour2D_on_globe!, oceanmask
import ClimaAnalysis.Utils: kwargs as ca_kwargs
import GeoMakie
import CairoMakie

fig = CairoMakie.Figure()

contour2D_on_globe!(fig,
                    var,
                    mask = oceanmask(),
                    more_kwargs = Dict(:mask => ca_kwargs(color = :blue)),
                   )

fig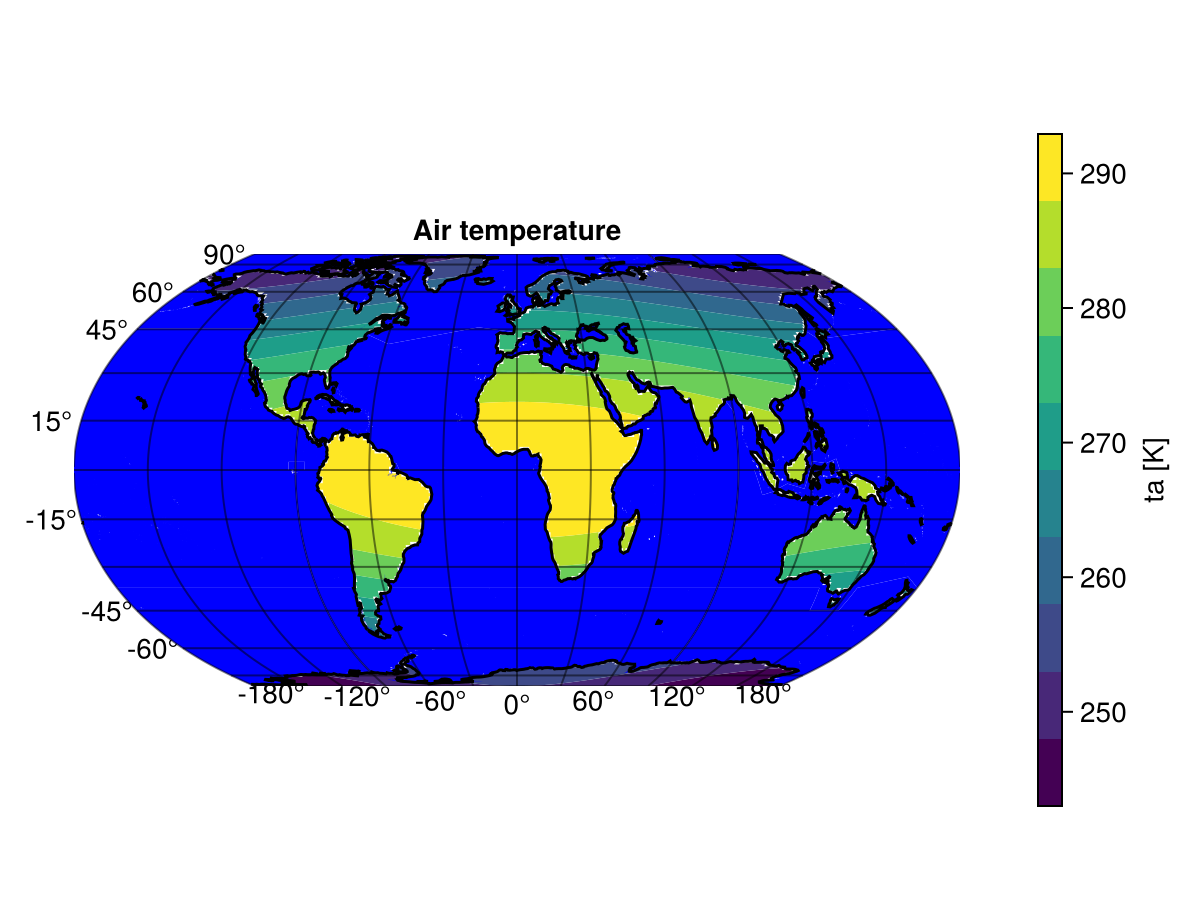
In this example, we plotted var on the globe and overplotted a blue ocean. ca_kwargs (Utils.kwargs) is a convenience function to pass keyword arguments more easily.
Plotting bias
After computing the bias between observational and simulation data, you may want to plot the bias and display information such as the root mean squared error (RMSE) and the global bias in the plot. To do this, you use the function plot_bias_on_globe!(fig, sim, obs). In the example below, we plot the bias between our simulation data (sim_var) and observational data (obs_var), where both are OutputVars defined over longitude and latitude.
import ClimaAnalysis
import ClimaAnalysis.Visualize: plot_bias_on_globe!
import GeoMakie
import CairoMakie

fig = CairoMakie.Figure()
plot_bias_on_globe!(fig, sim_var, obs_var)
fig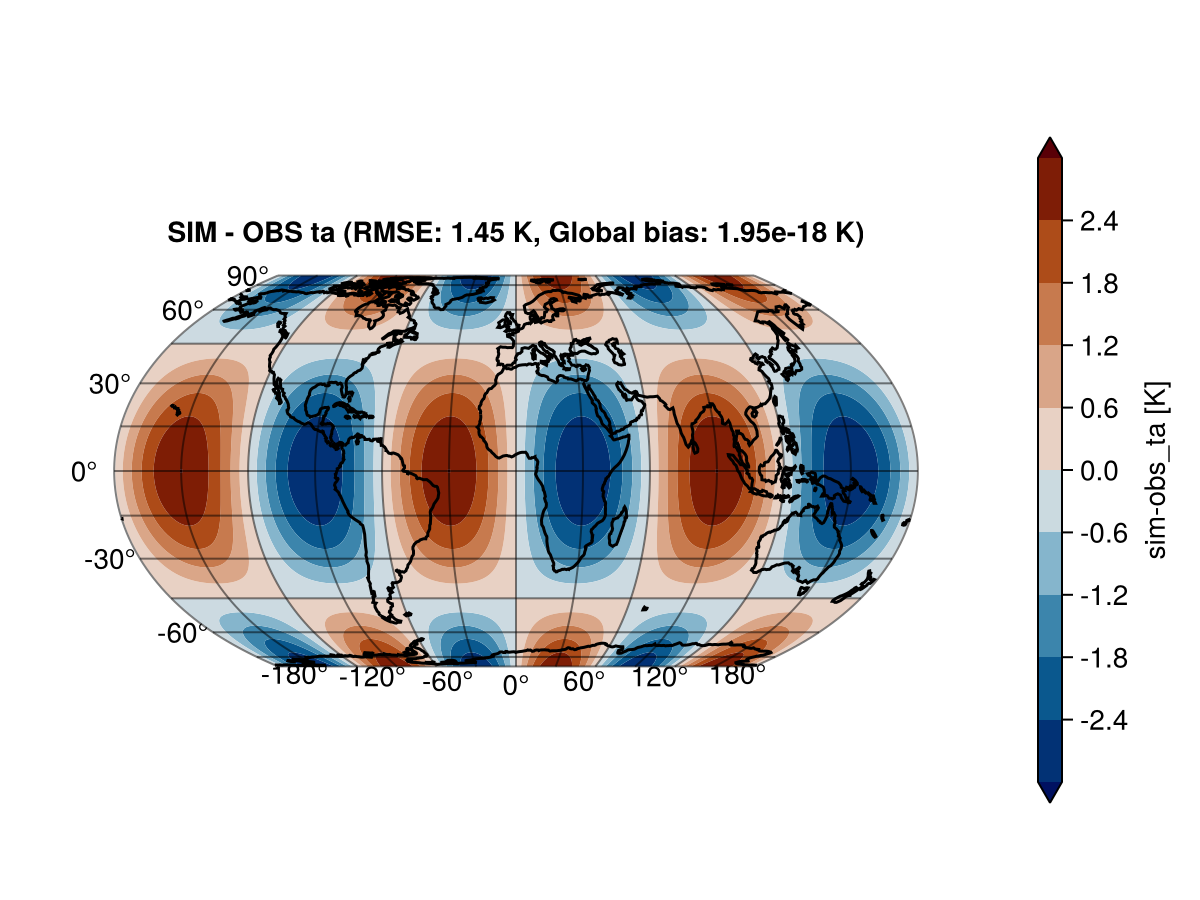
We can also plot the bias using an ocean mask. This also means we compute the bias only over land.
import ClimaAnalysis
import ClimaAnalysis.Visualize: plot_bias_on_globe!, oceanmask
import ClimaAnalysis.Utils: kwargs as ca_kwargs
import GeoMakie
import CairoMakie

fig = CairoMakie.Figure()
plot_bias_on_globe!(fig,
                    sim_var,
                    obs_var,
                    mask = oceanmask(),
                    more_kwargs = Dict(:mask => ca_kwargs(color = :blue)),
                   )
fig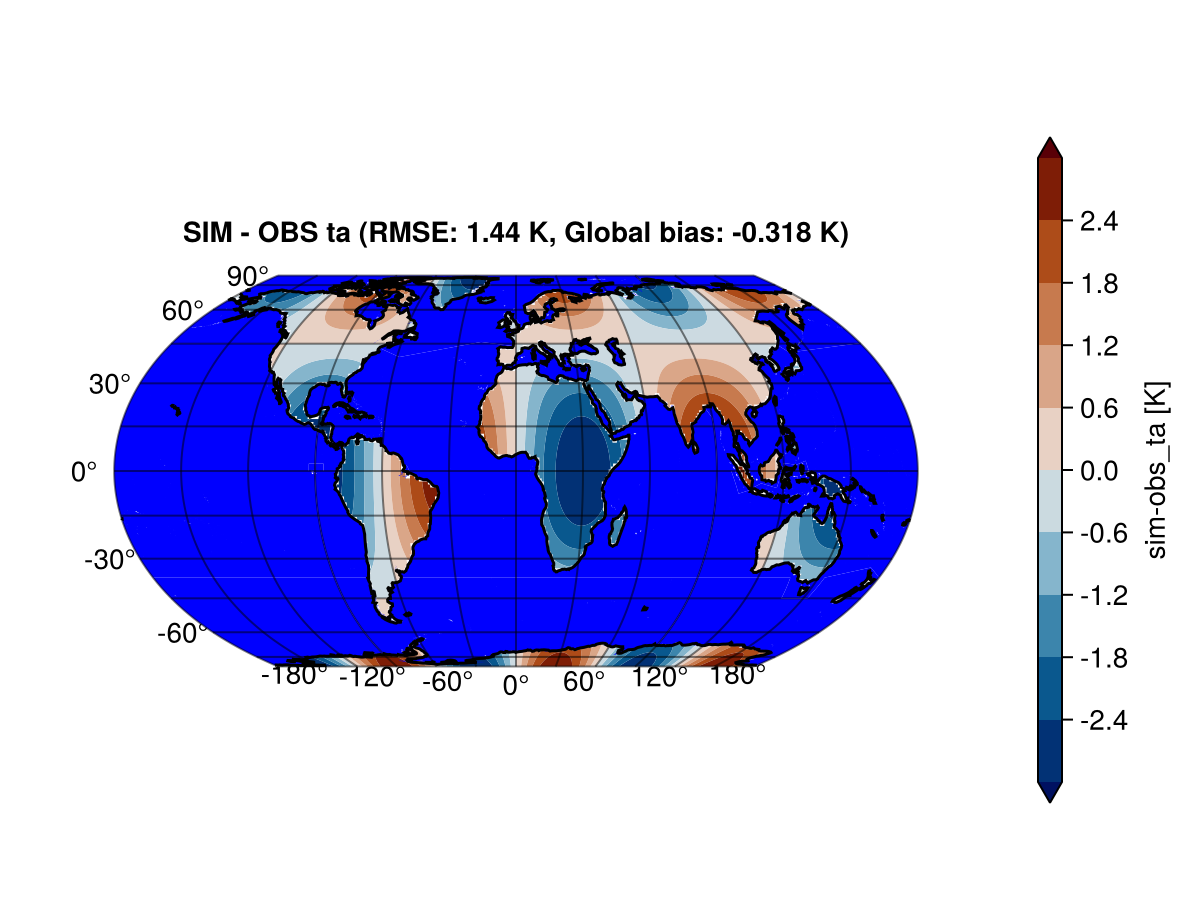
We can also plot the bias using a custom mask generated from generate_lonlat_mask. In the example below, mask_var is a OutputVar defined over longitude and latitude, whose data contains only zeros and ones, where the ones indicate land and the zeros indicate the ocean. The mask generated from ClimaAnalysis.generate_lonlat_mask(mask_var, NaN, 1.0) replaces values with NaN wherever the mask is zero and keeps values the same wherever the mask is one. As a result, the bias is plotted only over land.
ClimaAnalysis does not support mask keyword arguments for masking functions. If you want the values of the mask to not show in a plot, then pass NaN for the zero_to or one_to positional arguments of generate_lonlat_mask. The color of NaN is controlled by the keyword nan_color which can be passed for the plotting function (:plot).
Note that if the backend is CairoMakie, then the keyword nan_color does nothing. See this issue.
import ClimaAnalysis
import ClimaAnalysis.Visualize: plot_bias_on_globe!
import GeoMakie
import CairoMakie

mask_fn = ClimaAnalysis.generate_lonlat_mask(mask_var, NaN, 1.0)

fig = CairoMakie.Figure()
# Wrap mask_fn in a function so that it is recognized as a masking function
plot_bias_on_globe!(fig, sim_var, obs_var, mask = v -> mask_fn(v))
fig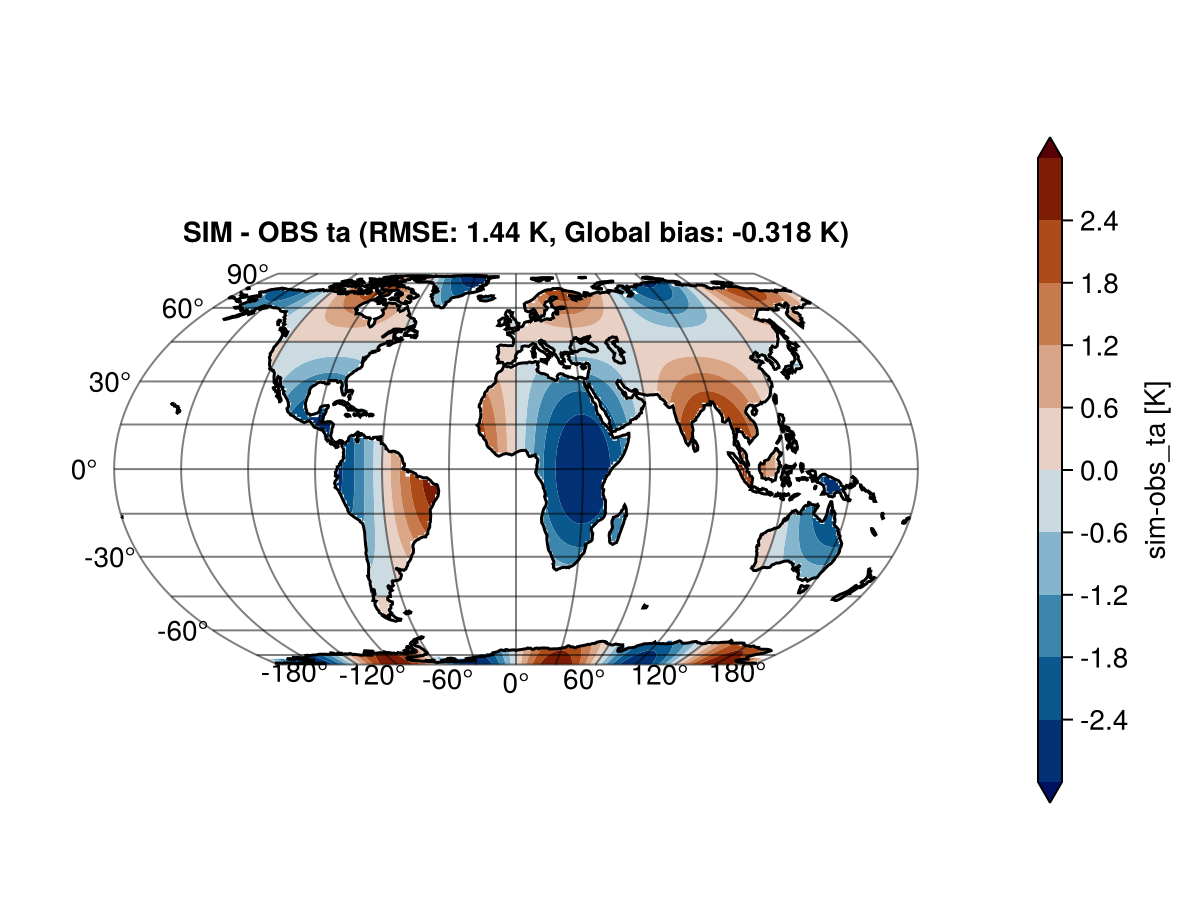
Makie integration
In versions of ClimaAnalysis after v0.5.22, Makie functions can be used natively with OutputVars. In the example below, we use the CairoMakie backend and the CairoMakie.plot function to plot var2d. The type of the plot is automatically determined by the number of dimensions of the OutputVar. This supports OutputVar representing one dimensional or two dimensional data.
import ClimaAnalysis
import CairoMakie

CairoMakie.plot(var2d; colormap = :thermal)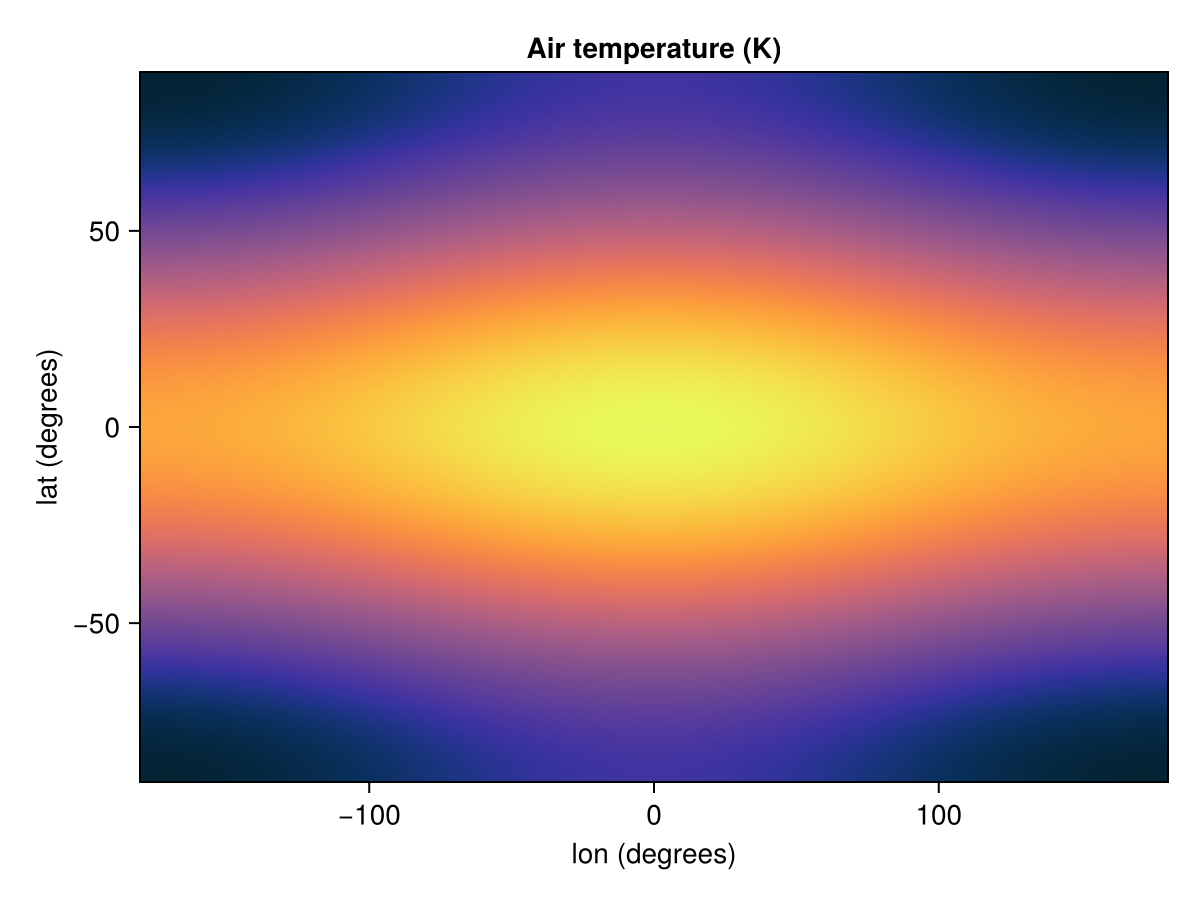
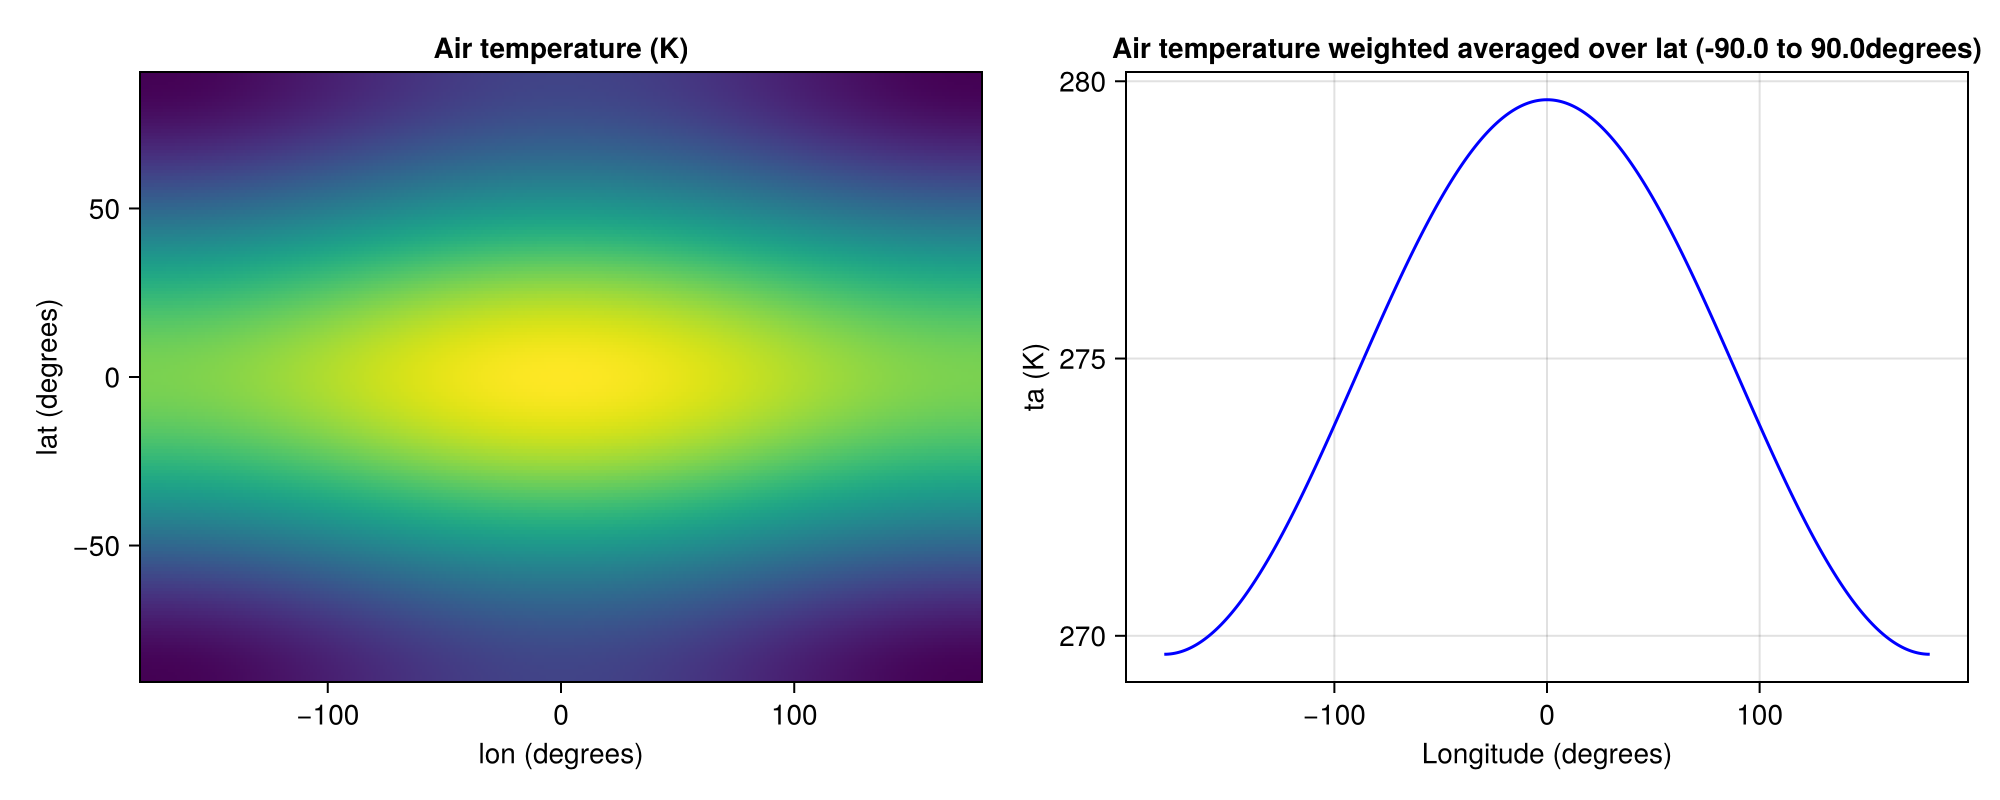
You can also use other plotting functions in Makie such as heatmap and lines. In this example, we use heatmap to plot a OutputVar with the longitude and latitude dimensions and lines to plot a weighted latitude-averaged OutputVar. You can expect most plotting functions from Makie to work out of the box.
fig = CairoMakie.Figure(; size = (1000, 400))
# If no axis is provided, then a default axis is added
CairoMakie.heatmap(fig[1,1], var2d)

# You can make your own axis for more customization
lat_weighted_var = ClimaAnalysis.weighted_average_lat(var2d)
long_name = ClimaAnalysis.long_name(lat_weighted_var)
lon_units = ClimaAnalysis.dim_units(lat_weighted_var, "longitude")
short_name = ClimaAnalysis.short_name(lat_weighted_var)
var_units = ClimaAnalysis.units(lat_weighted_var)
ax = CairoMakie.Axis(fig[1, 2], title = long_name, xlabel = "Longitude ($lon_units)", ylabel = "$short_name ($var_units)")
CairoMakie.lines!(ax, lat_weighted_var; color = :blue)
fig