Visualization
ClimaCalibrate provides primitive plotting utilities for plotting the mean forward map evaluation, columns of the G ensemble matrix, and the true observation via a Makie extension.
Since the plotting utilities are general, they may be insufficient for your use case. The plotting functions do not use metadata in the EKP.EnsembleKalmanProcess object, since the metadata are specific to the calibration that you are conducting. Hence, if these plotting utilities are insufficient, you should use the metadata to transform the data in the EKP.EnsembleKalmanProcess object to data that is more suitable for plotting.
To plot the mean forward map evaluation, columns of the G ensemble matrix, and the true observation, you can use Visualization.plot_g_mean, Visualization.plot_g, and Visualization.plot_obs respectively. The mutating versions also exist as Visualization.plot_g_mean!, Visualization.plot_g!, and Visualization.plot_obs!. All plotting functions takes an EKP.EnsembleKalmanProcess object to plot from. Additionally, the plotting function accept an iter keyword argument for plotting from a specific iteration. If the keyword argument is not provided, then the last iteration is used for plotting. You can expect all keyword arguments that work with Makie.Lines to also work with these plotting functions and that the plotting functions behave like Makie plotting functions.
You can enter help?> ClimaCalibrate.Visualization.plot_g in the Julia REPL to get a list of keyword arguments that work with Visualization.plot_g. You can do the same with the other plotting functions.
Example
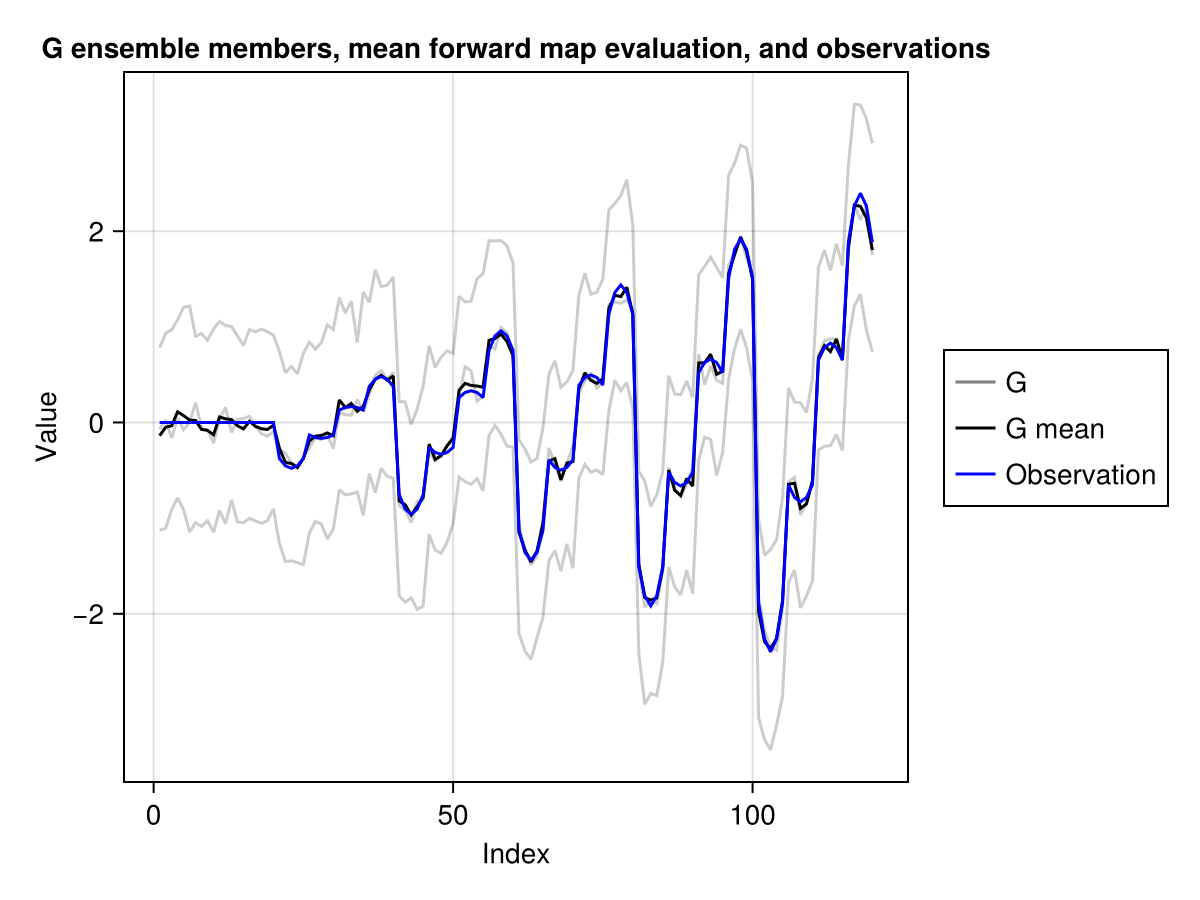
Here is a complete example where we use the plotting functions to plot the ensemble members, the mean forward map evaluation, and the true observations from the second iteration.
import ClimaCalibrate
# To use this extension, one of the Makie backends should be loaded
import CairoMakie

fig = CairoMakie.Figure()
ax = CairoMakie.Axis(
    fig[1, 1],
    title = "G ensemble members, mean forward map evaluation, and observations",
    xlabel = "Index",
    ylabel = "Value",
)
g_plot = ClimaCalibrate.Visualization.plot_g!(
    ax,
    ekp;
    iter = 2,
    color = :black,
    alpha = 0.2,
)
g_mean_plot =
    ClimaCalibrate.Visualization.plot_g_mean!(ax, ekp; iter = 2, color = :black)
obs_plot =
    ClimaCalibrate.Visualization.plot_obs!(ax, ekp; iter = 2, color = :blue)

CairoMakie.Legend(
    fig[1, 2],
    [g_plot, g_mean_plot, obs_plot],
    ["G", "G mean", "Observation"],
)

fig